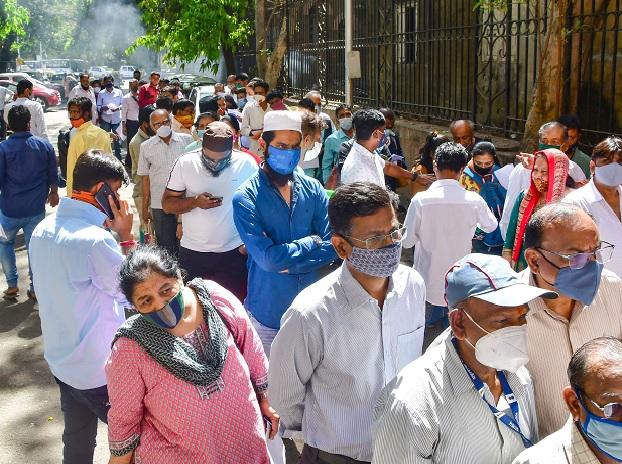
Beginning in February, India was hit by a second wave of Covid-19 infections. Between February 11 and May 9, when the second wave peaked, the seven-day average of daily new infections increased 36 times. Although the number of new cases per day has dropped dramatically since then, the latest statistics emphasise the need for caution. This is especially important in light of anecdotal reports of Covid-inappropriate behaviour in a variety of locations, particularly tourist destinations. Here are four graphs to help you understand what’s going on.
- While new infections are not increasing, they are also not decreasing at a rapid enough rate.
After peaking on May 9, 2021, the 7-day averages of daily and active Covid-19 cases continue to decline. However, two months after the peak of the second wave, the infection’s trajectory in India has taken a worrying turn. The downward trend in cases has slowed, and the positivity rate has increased slightly. Worse, daily new cases have been rising in recent days, though it’s too early to call this the start of the next wave without a clear increase in 7-day averages.
- An increase in the rate of positivity is cause for concern.
While the number of new cases continues to decline, the positivity rate has already begun to rise. On May 9, the seven-day average of daily positivity rates peaked at 22.76 percent. After that, it falls to a low of 2.19 percent on July 2. In the last week, this number has risen slightly. The seven-day average of daily positivity rate was 2.27 percent on July 7. While the increase is minor and recent, it is a cause for concern.
- The situation on a state-by-state basis
The disparities between states are hidden by the all-India figures. In six small north-eastern states and Kerala, the seven-day average of new cases has been rising. Over the last week, optimism levels have risen in 11 states and UTs. On July 7, there were four states where the 7-day average of positivity was greater than 10%, and another four where it was between 5% and 10%. The number of cases will continue to rise as positivity rates rise.
- Other states’ districts are also impacted.
The 7-day average of cases increased in 63 districts out of 707 for which data is compiled by How India Lives (Delhi’s districts are merged into one); 36 of them are from the eight north-eastern states, and 18 from Kerala, Maharashtra, and Odisha. However, in the last two weeks, cases have increased in a few districts, even in other states.
The lack of publicly available daily district-by-district positivity rates that can be compared to the cases in those districts remains a significant barrier to red-flagging vulnerable districts before it’s too late.


